Complete training
The simulator as a complementary tool
Training programmes had existed for a long time before simulation emerged. Indeed, training has been a human need throughout all of history, and many different methods and tools have been used for these purposes.
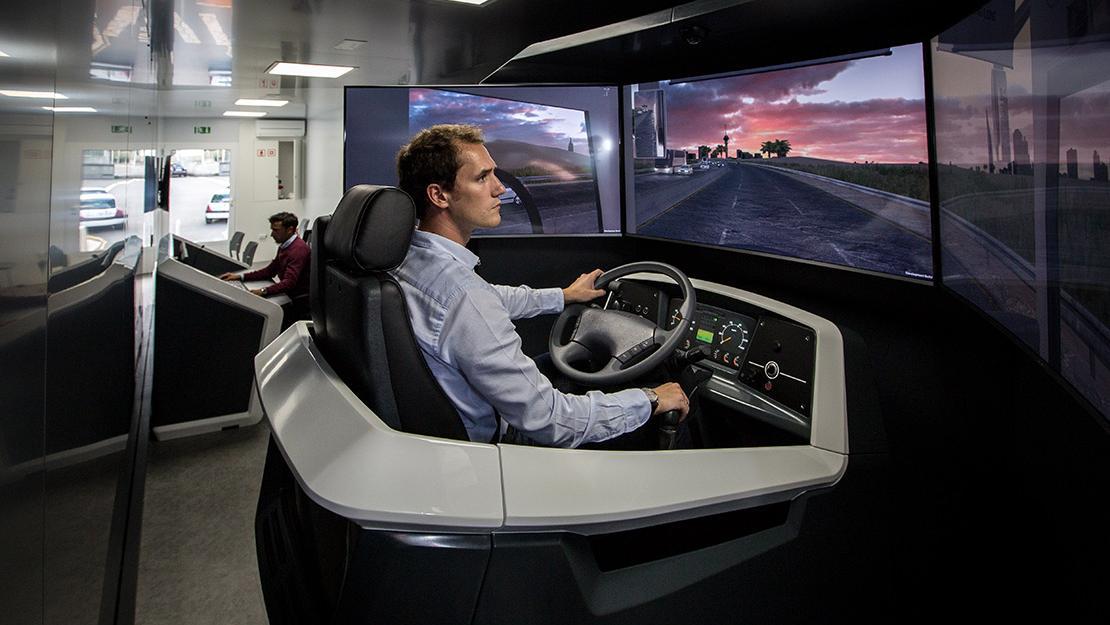
Simulators are an essential complement for any safe and efficient training programme
The tool for closing the cycle
This is why it is important to respect this teaching tradition and to think of simulators as complements to other standard teaching instruments.
A safe and efficient environment
Simulation allows for training in hazardous situations that would be very difficult or nearly impossible to experience in real life. Malfunction in the train itself and unusual behaviour in other vehicles or pedestrians are everyday realities that can only be safely experienced with a simulator.
Simulation moreover allows for improved efficiency in training and in transport. The ability to shorten training periods and increase their scope, the possibility of replicating lessons for a large number of trainees as well as instruction in efficient driving methods allow for optimisation of transport costs.